Figure 5.

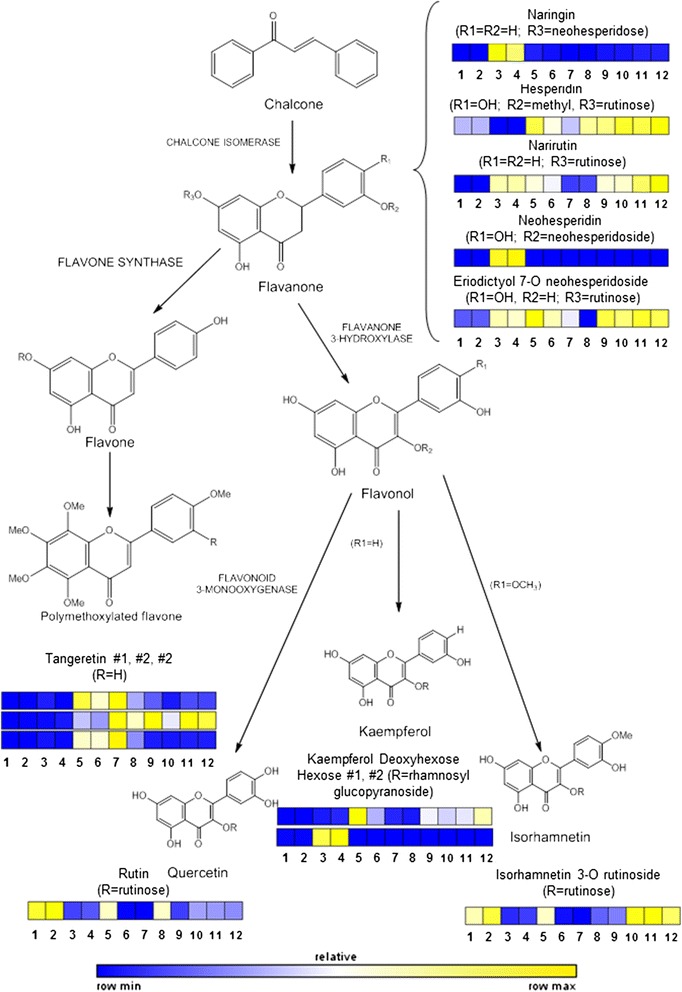
Scheme of flavonoid metabolic pathway arising from chalcone (not analyzed). On every compound a color scale indicates relative amounts in juices of each variety studied. Sample ID followed the same order as in Table 1.

Scheme of flavonoid metabolic pathway arising from chalcone (not analyzed). On every compound a color scale indicates relative amounts in juices of each variety studied. Sample ID followed the same order as in Table 1.