
Figure 2.
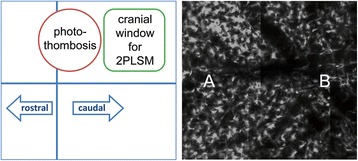
Illustration of 2-photon-laser-microscopy image (2PLSM) analysis. In the cartoon to the left the red circle represents the photothrombotic stroke, and the green square the thinned skull-window, through which green fluorescent protein (GFP)-CX3CR1+ cells were imaged. Close to the infarct we defined region A, representing the peri-infarct zone. The opposite side of the cranial window was defined as region B.