
Figure 7.
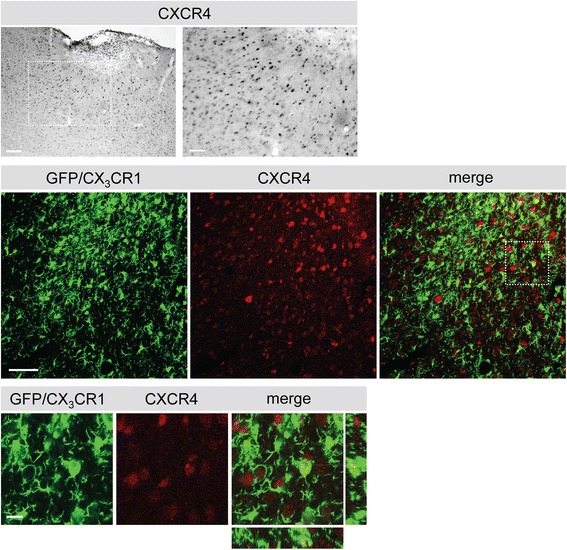
Phenotype of green fluorescent protein (GFP)-positive cells in the ischemic territory. Upper panel: expression of CXCR4 in the ischemic territory 14 days after photothrombosis (PT). A higher magnification of the squared area is shown to the right. Scale bars: left 100 μm; right 50 μm. Lower panel: co-staining for CXCR4 (Cy5, red) and GFP (green, CX3CR1) in the proximal peri-infarct area. Higher magnification of the squared area is shown in the bottom panel. Scale bars: low magnification 50 μm, high magnification 10 μm.