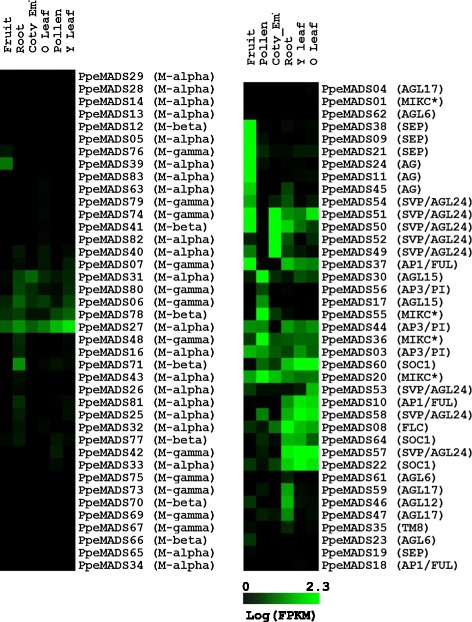
Figure 6.

Expression profiles of Type I (left) and Type II (right) MADS-box genes from six peach tissues: root, expanded leaf (O Leaf), young leaf (Y leaf), fruit, pollen and cotyledon + embryo (Coty_embryo) tissue. FPKM expression values were log-transformed, and genes were grouped by average linkage clustering (see Methods).
