
Figure 2.
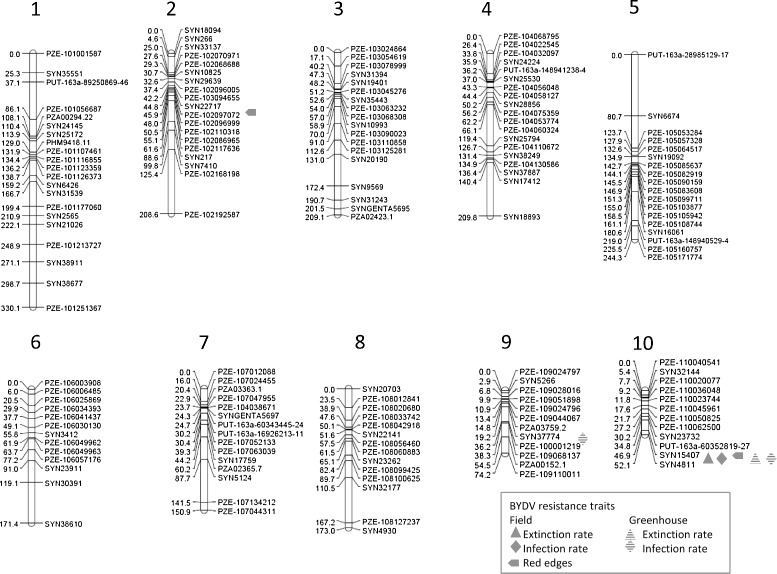
Projection of the QTL identified in this study on the genetic consensus map. QTL are illustrated by symbols for the traits red edges (RE), virus extinction (EX), and infection rate (IR) from the field experiment, and for the traits EX and IR, from the the greenhouse experiment.