Figure 7.

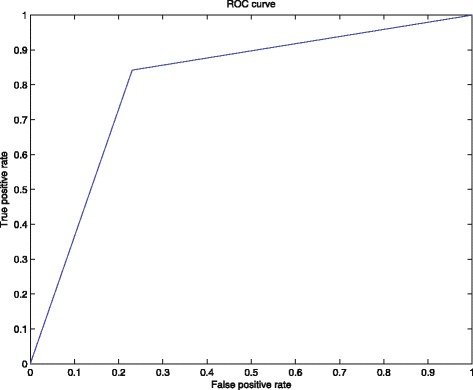
The ROC curve obtained for the SVM model. The plot was built with perfcurve matlab function using the information shown in Table 5. The value obtained for the AUC was 0.805.

The ROC curve obtained for the SVM model. The plot was built with perfcurve matlab function using the information shown in Table 5. The value obtained for the AUC was 0.805.