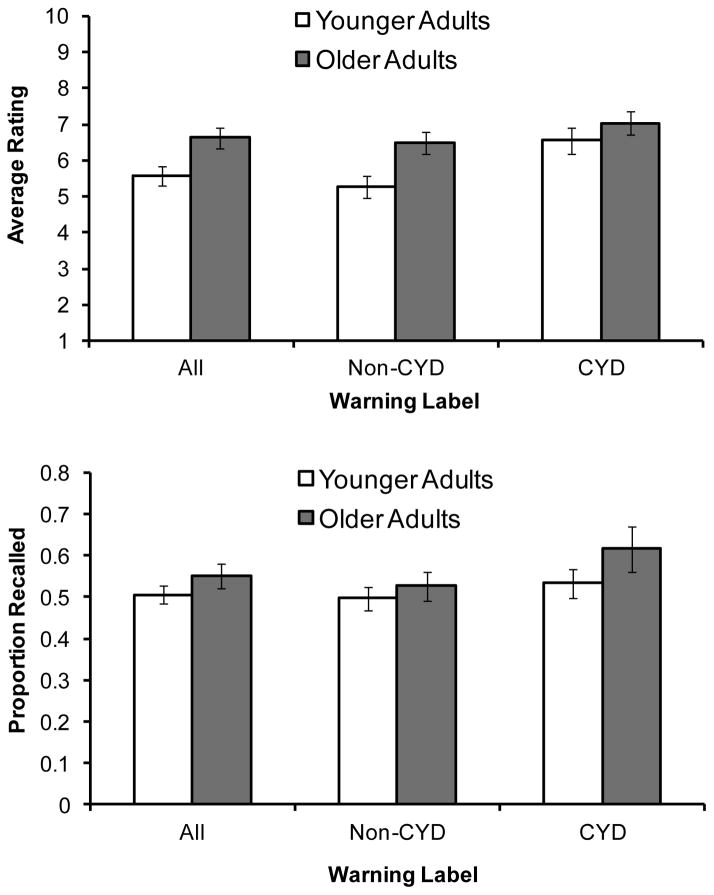
Figure 2.
The mean ratings (top panel) and proportion recalled (bottom panel) of side effects in Experiment 2 based on the assigned warning categories and the age group of the participants. CYD refers to “Contact Your Doctor” if the participant were to experience these side effects. Since there were three times as many non-CYD side effects as there were CYD side effects, separate bars are shown to depict overall performance (“All”, shown on the left side of each graph) as well as the non-CYD and CYD side effects. Error bars represent standard error.

