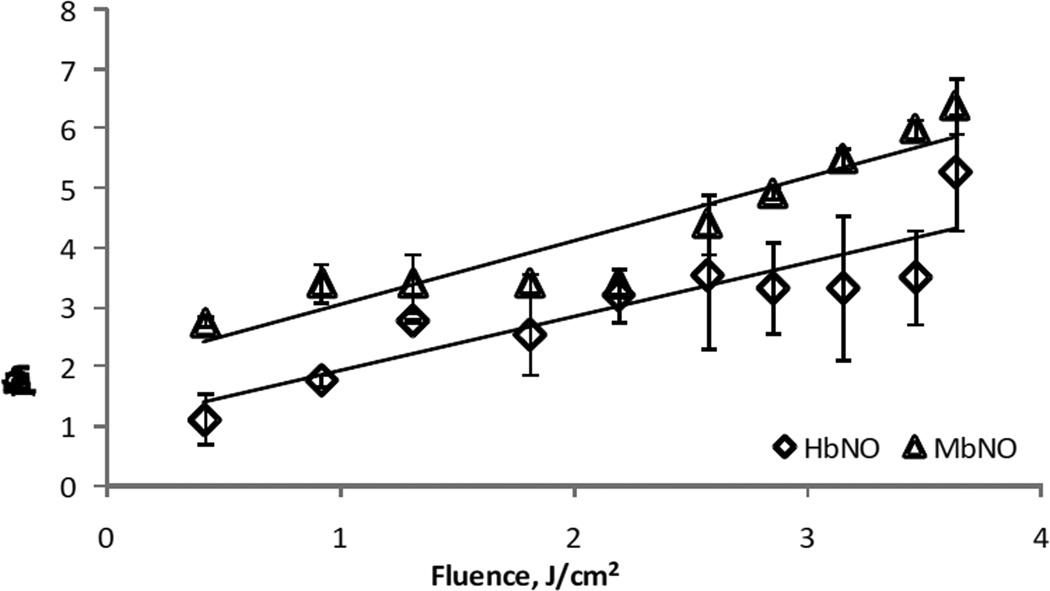
Figure 3.
Quantification of NO release from HbNO by R/NIR as a function of power. 20µM HbNO and MbNO were irradiated with 670nm light at different fluences. NO release was quantified by extrapolation to a standard curve generated from Proli-NONOate. The rate of HbNO and MbNO decay increases with greater fluence.

