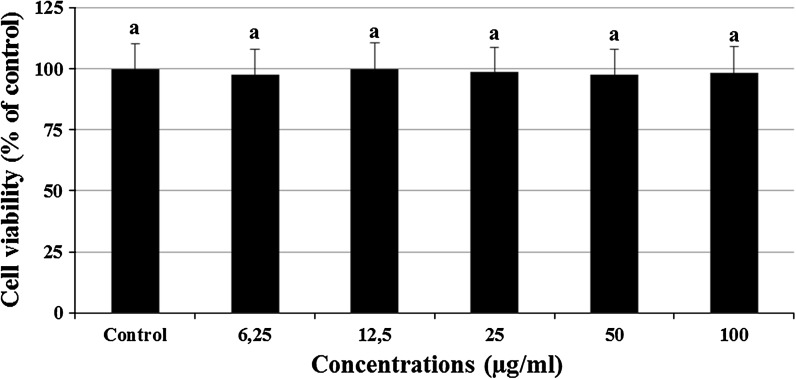
Fig. 2.
Viability of rat primary cortical neurons after 24 h exposure to (0–100 μg/ml) CSV. The results are presented as percentage of the control group (n = 4). Data are expressed as mean ± SD. Values with the same superscript letters are not significantly different from each other at the level of p < 0.05

