Fig. 5.
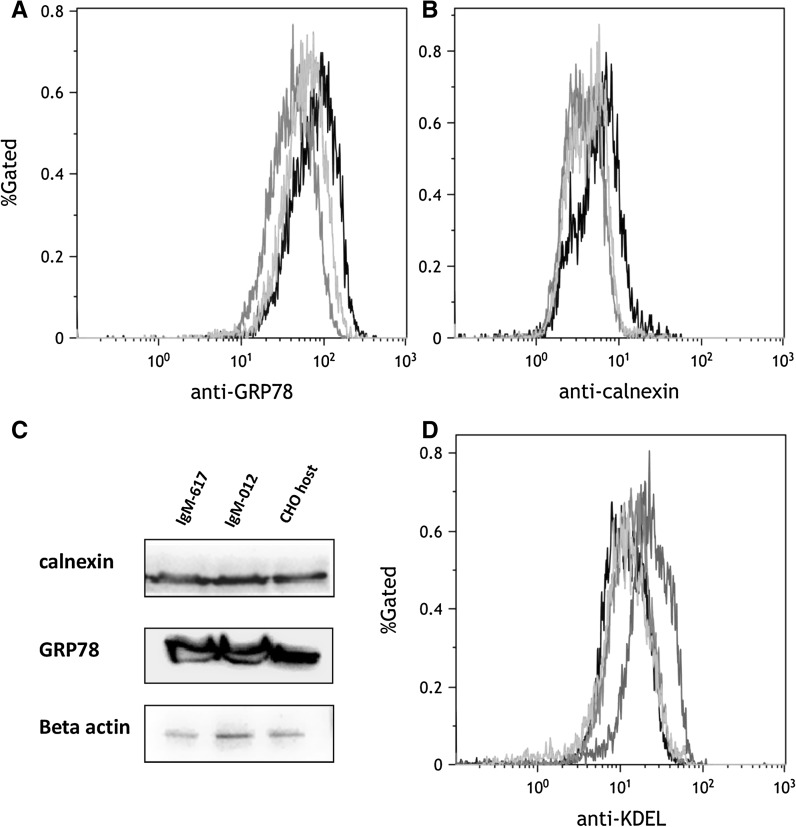
Presence of ER stress within CHO IgM producing cells: No significant difference between the host and recombinant cell lines in a GRP78 and b calnexin protein levels were observed (host cell line in black, IgM-012 in green, IgM-617 in orange colors). Measured 10,000 events per sample; y-axis % gates, 1 = 100 %. c Western blot analysis confirmed observed results—intensity of calnexin and GRP78 bands was similar for host as well as recombinant CHO cell lines. Beta-actin was used as internal control. d To explore overall chaperone level, ER-retention signal (KDEL) inside the cells were analyzed by flow cytometry. Host cell line was treated with 2 μg ml−1 tunicamycin for 12.5 h, to induce ER-stress (red color). Recombinant IgM-expressing CHO clones did not show increased chaperone levels (CHO host untreated in black, CHO, IgM-012 in green, and IgM-617 in orange color). (Color figure online)

