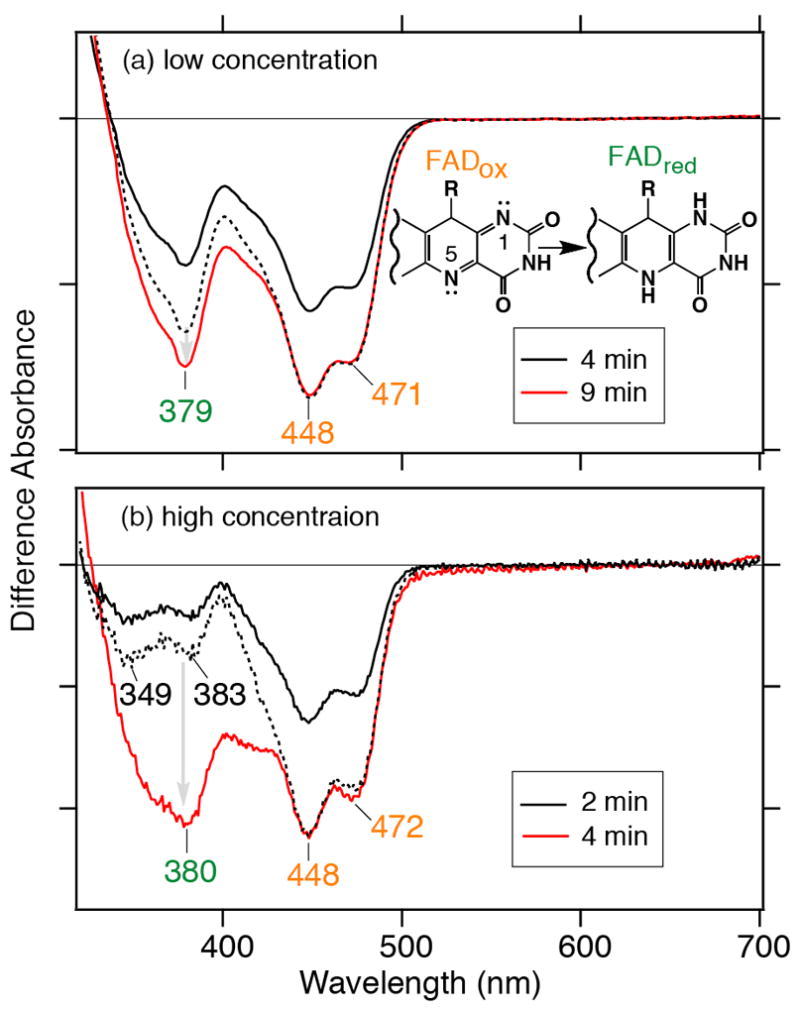
Figure 2.

Light-induced UV–vis difference spectra upon photoreduction of SCry-DASH. White light illumination was carried out at (a) low and (b) high protein concentrations in the presence of 100 mM DTT. The low concentration sample was exposed for 4 or 9 minutes, while the higher concentration sample was exposed for 2 or 4 minutes. In the respective panels, the shorter exposure is shown in black, and the longer exposure is in red, respectively. The black dotted line indicates the magnified spectrum of the shorter exposure spectrum (black solid line), 1.45-times for the low exposure sample and 1.7-times for the high exposure sample (see details in the text). One division of the y-axis corresponds to 0.04 (a) or 0.005 (b) absorbance units.
