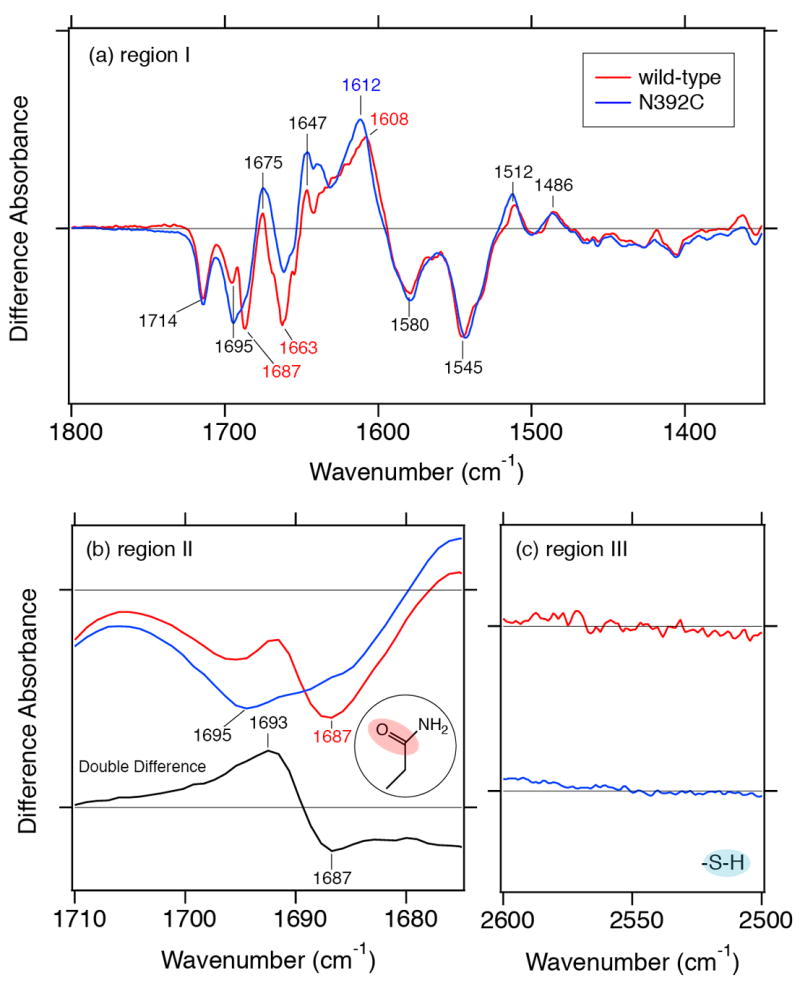
Figure 6.

Impact of mutations on difference FTIR spectra. Difference FTIR spectra of FAD•−/FADox of wild-type SCry-DASH (red line) and N392C mutant (blue line) were compared in three ranges: (a) 1800–1350 cm−1, (b) 1720–1670 cm−1, and (c) 2600–2500 cm−1. Respective data for wild-type and the N392C mutant are identical to data shown in Figure 4c and d, respectively. Bottom black trace in panel b shows the double-difference spectrum between wild-type and the N392C mutant, where the N392C mutant spectrum (blue line) is subtracted from the wild-type spectrum (red line).
