
Figure 4.
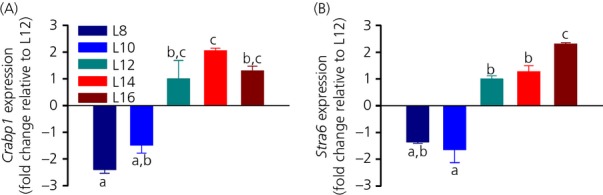
Effect of photoperiod on hypothalamic retinoic acid signalling genes. (a) Crabp1 and (b) Stra6 mRNA expression under five different photoperiods. For each group, different lowercase letters above bars indicate significant differences (P < 0.05) between photoperiod groups. Data are shown as fold changes relative to L12 (± SEM).