
Figure 5.
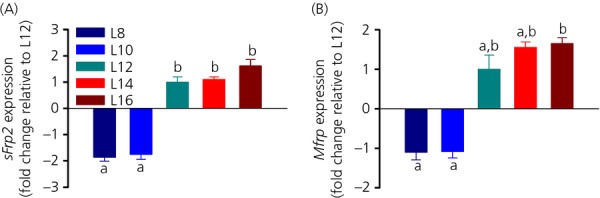
Effect of photoperiod on hypothalamic Wnt/β-Catenin signalling. (a) sFrp2 and (b) Mfrp mRNA expression under five different photoperiods. For each group, different lowercase letters above bars indicate significant differences (P < 0.05) between photoperiod groups. Data are shown as fold changes relative to L12 (± SEM).