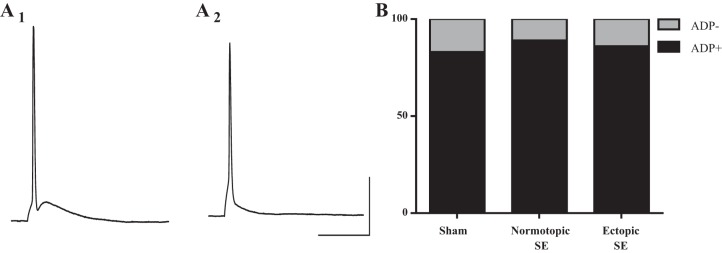
Fig. 10.

Two distinct shapes of single AP traces were observed in all three groups of rodent DGCs. Example trace showing AP: with a prominent ADP (A1) and without an ADP (A2). B: graph showing the distribution of single-spike AP type across all groups. There was no significant difference in the percentage of cells that fired each type of AP across any of the three groups (P = 0.91, Fisher's exact test). Scale bars: 20 ms, 25 mV.
