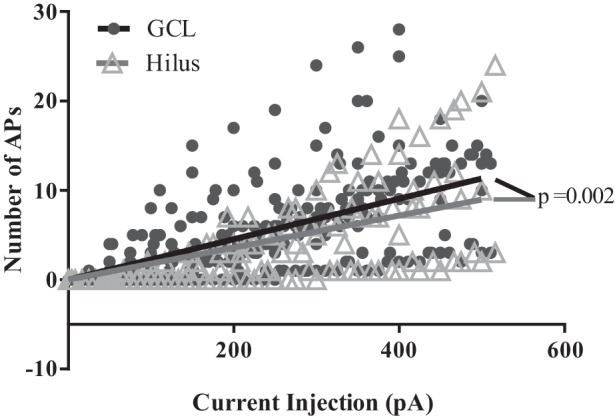
Fig. 3.

Hilar DGCs are slightly, but significantly, less excitable than DGCs in the GCL. All cells fire at least one AP in response to ≥300 pA of injected current. The solid black and gray lines were generated by fitting the respective scatter plot data with a Poisson regression line that passes through the origin. The slope of the regression line for hilar cells (0.01794 ± 0.001277) is significantly different from the slope of the line for GCL cells (0.02266 ± 0.0015, P = 0.0019, extra sum of squares F-test).
