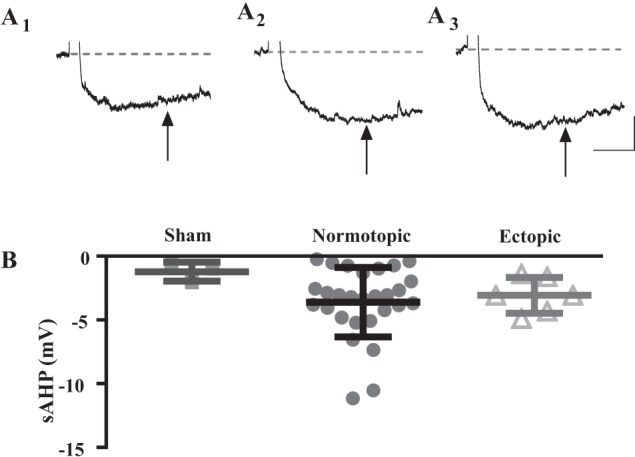
Fig. 9.

A subset of cells from each group exhibited postburst sAHP. Representative traces are from a cell from a sham-treated animal (A1), a normotopic cell from an SE-treated animal (A2), and an ectopic cell from an SE-treated animal (A3). B: there was no significant difference in the mean size of the postburst sAHP between any of the groups (P = 0.311, one-way ANOVA). All values are means ± SE. Scale bars: 500 ms, 2 mV.
