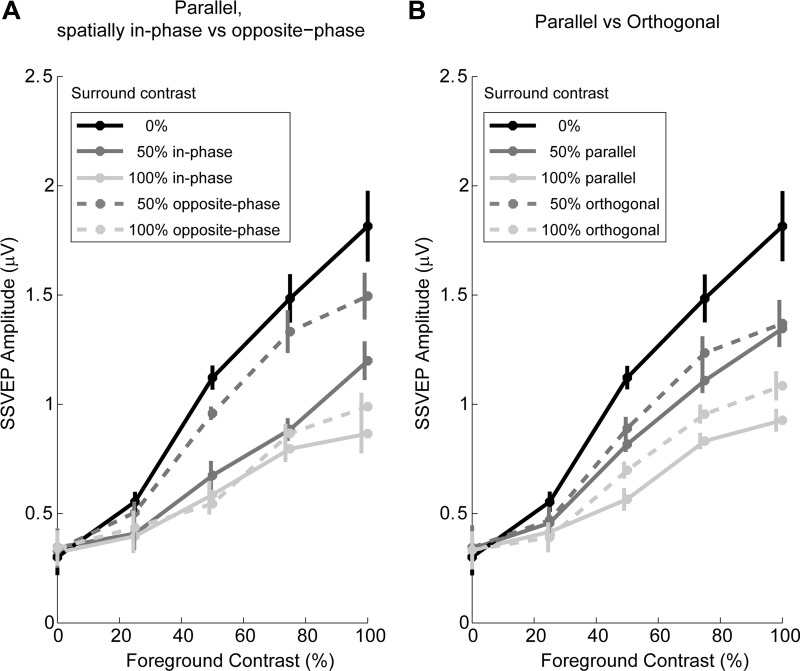
Fig. 3.
Average SSVEP contrast response functions across 2.24 s of peripheral stimulation at 25 Hz. A: parallel surround configuration, comparing spatially in-phase (solid lines) and opposite-phase (dashed lines) surrounds (configuration 1). B: comparison of parallel (solid lines; configuration 1) vs. orthogonal (dashed lines; configuration 2) surround, collapsed across surround spatial phase. Error bars represent the standard error of the mean after subtracting intersubject variance not relevant to repeated-measures comparisons (Cousineau 2005). A single 0% surround trace is shown because surround spatial phase and orientation are meaningless in this case. Note that contrast is plotted on a linear rather than logarithmic scale as is typically done, as our FG contrasts were spaced linearly.

