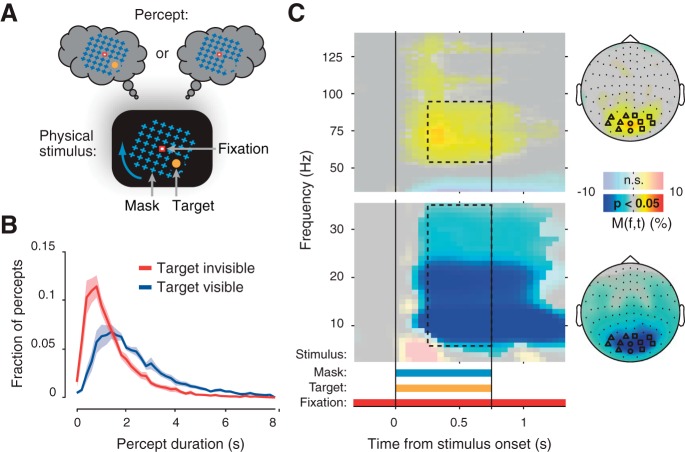
Fig. 1.
Motion-induced blindness (MIB) stimulus, perceptual dynamics, and cortical stimulus response. A: schematic of the MIB illusion. Bottom, stimulus configuration. The small but salient target (yellow disc) was surrounded by a large moving mask (rotating blue grid). The target was presented in different visual field quadrants for different subjects, at an eccentricity of 3°. Top, alternating perception of the target. B: group average frequency distributions of target invisible and target visible durations during magnetoencephalography (MEG; n = 11 subjects). Shaded areas indicate SE. C: cortical response to the MIB stimulus during Stimulus-on-off condition. Scalp maps show topography of 8- to 35-Hz and 60- to 90-Hz modulations (0.25–0.75 s after stimulus onset; see dashed outlines on time-frequency representations). Transparency level indicates clusters of significant modulation (P < 0.05, 2-sided permutation test across subjects, cluster-corrected; n = 10 subjects). Highlighted symbols indicate MEG sensors showing the biggest stimulus response. These sensors are used for the subsequent analyses of overall power modulations (triangles and squares, sensors used for lateralization analyses; Fig. 3). M(f,t), power modulation.

