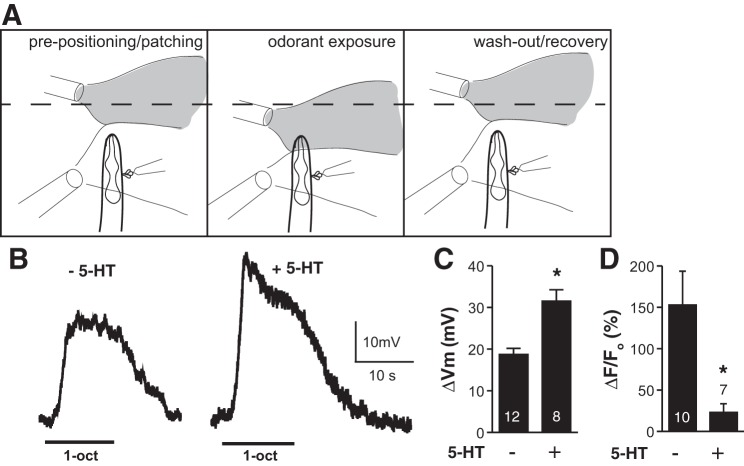
Fig. 5.
5-HT potentiates ASH depolarization in response to 1-octanol. A: diagram of recording setup. Left: arrangement of pipettes before exposure, as whole cell recording is being established. At bottom right, the recording pipette and protruding neuronal cell bodies are shown. At top left, flow pipette providing 1-octanol solution and a fluorescent dye to monitor flow (shaded plume) is shown; at bottom left, flow pipette providing a stream of buffer to shield exposed neuron is shown. Exposure is initiated by moving 1-octanol pipette to preset position closer to nose (middle), and terminated by returning 1-octanol pipette to original position (right). B: representative traces of ASH depolarization in response to 1-octanol exposure in control (left) or 5-HT-treated worms (right). C: 5-HT effect on ASH 1-octanol-induced depolarization. ΔVm, change in membrane potential. *P < 0.0005. D: 1-octanol responses of ASH neurons dissected for electrophysiology, but analyzed by Ca2+ imaging, showing that 5-HT signaling to reduce Ca2+ signals remained intact through the dissection process. *P < 0.05. Values are means ± SE; nos. within/above bars indicate n.

