Figure 11.
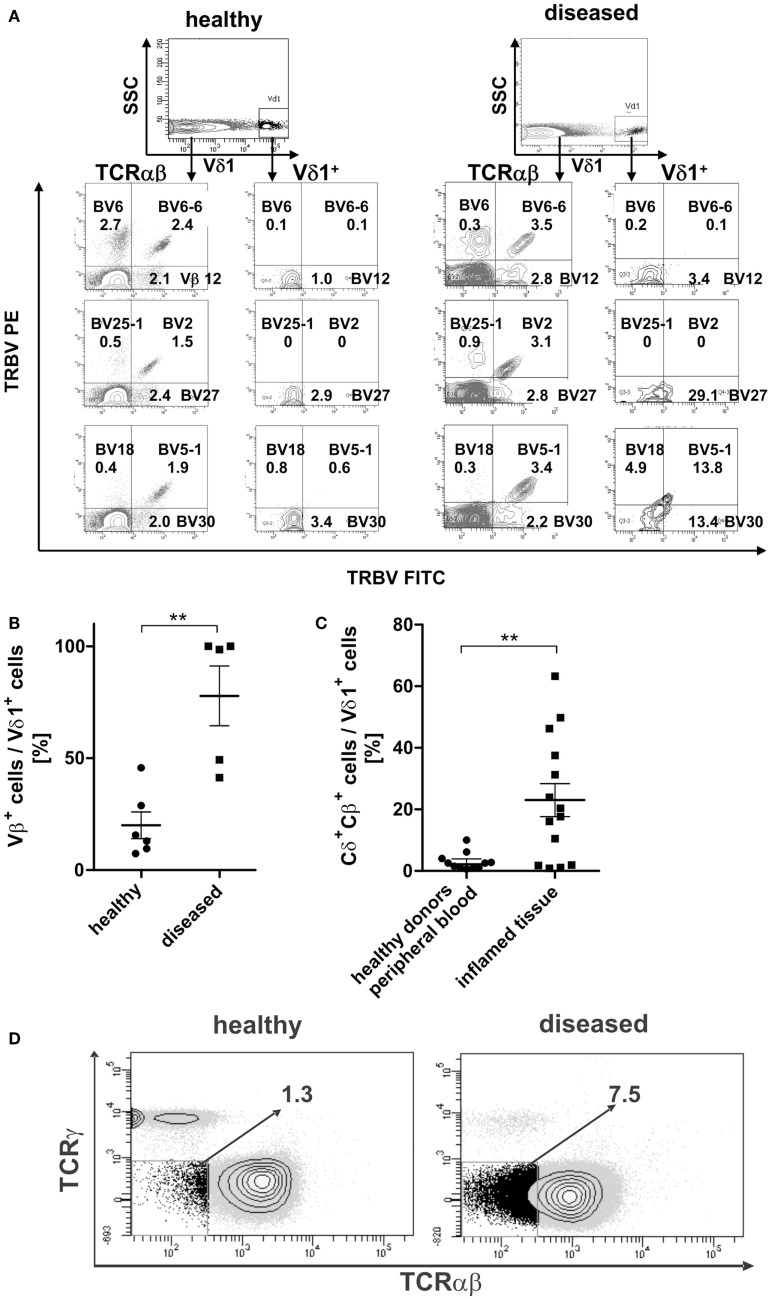
Surface Vβ expression of αβT cells in comparison with peripheral Vδ1+ T cells in healthy and diseased individuals. (A) Representative Vβ family staining pattern (exemplarily shown are nine different Vβ families) on αβT cells and Vδ1+ T cells in peripheral blood MNCs shown for one healthy individual and for one individual suffering from viral infection. MNCs were stained with the TCR Vβ Repertoire Kit (Beckman Coulter); three different Vβ family expressions are assessed in the same tube by combining three monoclonal antibodies (mAb) with only two fluorophores (see Materials and Methods for detailed information). (B) Percentage of Vβ+ expressing cells in the Vδ1 subset in healthy (n = 6) and diseased individuals (n = 5). (C) Percentage of Vδ1 cells with a Cδ+Cβ+ phenotype in healthy (n = 11) tissue differs significantly from that of body fluids of inflamed tissue (n = 14) (p = 0.0343). (D) CD3+ cells that are Cγneg. and TCR-αβ framework-epitopeneg. (DN for TCR) in healthy (n = 11) and diseased individuals (n = 4). One representative blot is shown.

