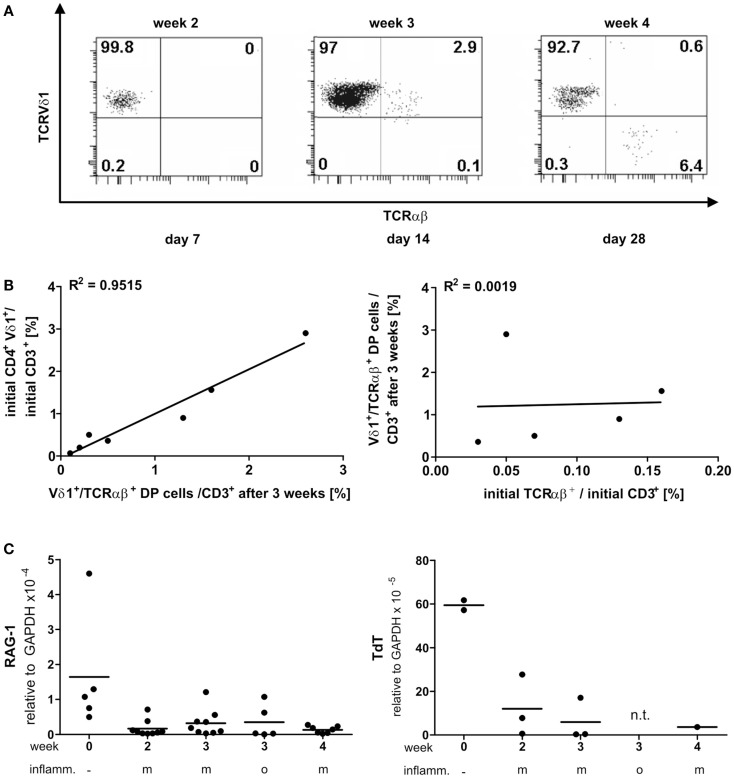
Figure 7.
Vδ1+ T cells differentiate into αβT cells. RAG and TdT expression in panVδ1+ cultures, native and over time in different inflammatory culture conditions; correlation of TCR DP cells with CD4+Vδ1+ and residual αβT-cell numbers in initial panVδ1+ T-cell pools. (A) panVδ1+ T cells cultivated in the presence of IL-7, PHA, IL-2, and irradiated allogeneic feeder cells gave rise to a cell fraction that co-expressed Vδ1 and TCR-αβ after 3 weeks, before differentiating into TCR-αβ+ T cells. Series of dot plots are representative of 12 independent experiments. (B) Number of Vδ1+/TCR-αβ+ cells varied between individuals (mean: 0.926%/Vδ1+; range 0.1–3%) (right) as did the number of produced αβT cells (mean: 1.82%/Vδ1+; range 0.2–6.0%) (left); Vδ1+/TCR-αβ+ double-positive cells in week 3 of culture corresponded with the number of CD4+ Vδ1+ T cells in initial Vδ1+ T-cell pool (left). There was no correlation between residual TCR-αβ+ T cells after Vδ1+ cell separation and set-up of initial Vδ1+ T-cell culture and the number of Vδ1+/TCR-αβ+ double-positive T cells after 3 weeks of culture (right). Each dot represents one independent experiment. (C) After initial depression, RAG-1 and TdT quantities subtly increased in Vδ1+ cell cultures and were detectable simultaneously with the appearance of Vδ1+/TCR-αβ+ coexpressing cells. m, Mild inflammation (IL-7, PHA, IL-2, and irradiated allogeneic feeder cells); o, overt inflammation (exposure to strong inflammatory stimuli in week 3, conditions described in the Section “Materials and Methods”); week 0, freshly isolated, native Vδ1+ cells were analyzed.

