Fig. 5.
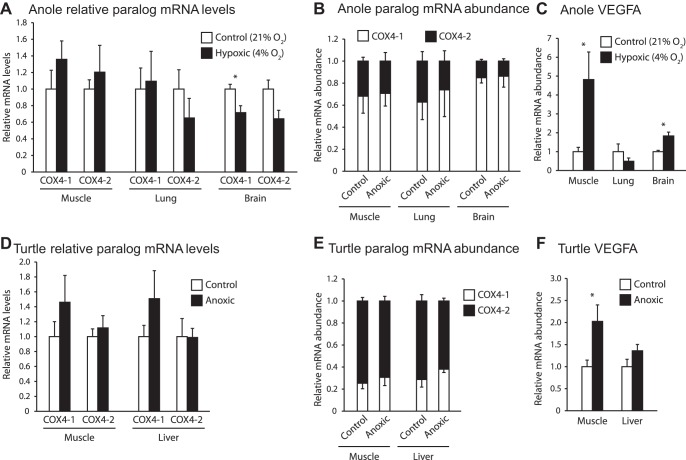
Transcriptional response of COX4 paralogs to hypoxic treatments in reptilian species. A–C: response in muscle, lung and brain tissues of green anole exposed to 4% O2 for 24 h. D–F: response in muscle and liver tissues of Western painted turtles exposed to 24 h or anoxia; n = 6 per treatment. A and D: mRNA levels for COX4-1 and COX4-2 relative to control treatments. B and E: proportion of COX4 transcripts present as COX4-1 or COX4-2. C and F: relative mRNA levels for VEGFA, a known hypoxia-responsive gene. *Significant difference from the control treatment as determined by a Mann-Whitney U-test. Error bars depict SE.

