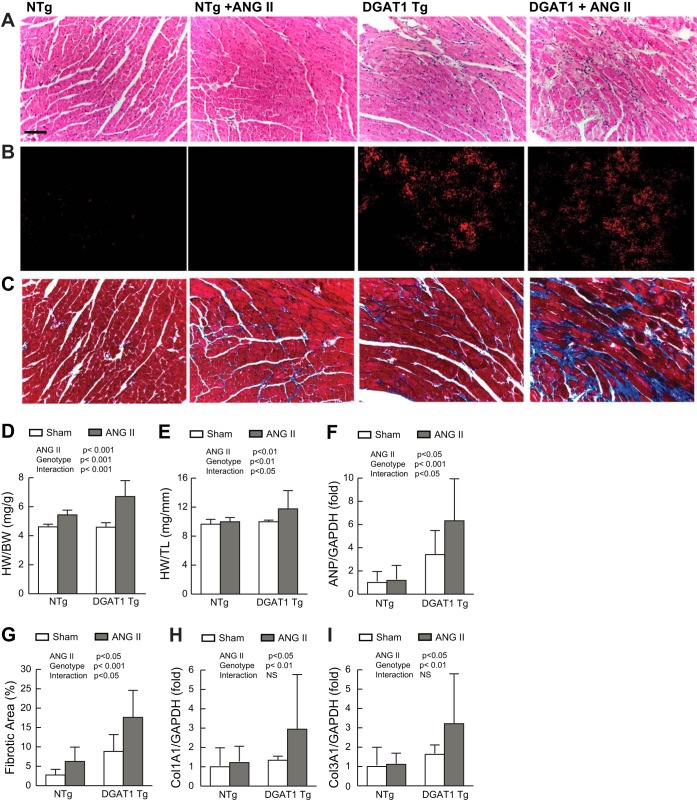
Fig. 2.
Cardiac hypertrophy and fibrosis in MHC-DGAT1 Tg mice treated with ANG II. A–C: representative left ventricular (LV) micrographs in sham and ANG II-treated NTg and MHC-DGAT1 Tg mice stained with hematoxylin and eosin (A), oil red O (B), where red fluorescence indicates lipid accumulation, and Masson's trichrome stain (C), where blue-green stain indicates fibrosis. Bars = 50 μm. D and E: calculated heart weight-to-body weight ratios (HW/BW; D) and heart weight-to tibia-length ratios (HW/TL; E). F: atrial natriuretic peptide (ANP) gene expression normalized to GAPDH expression and compared with the NTg sham group as assessed by quantitative PCR. G: quantification of fibrotic area, expressed as a percentage of tissue area. H and I: gene expression analysis of collagen type 1A1 (Col1a1; H) and type 3A1 (Col3A1; I) normalized to GAPDH expression. n = 6 NTg, NTg + ANG II, and MHC-DGAT1 Tg mice and 9 MHC-DGAT1 Tg + ANG II mice.

