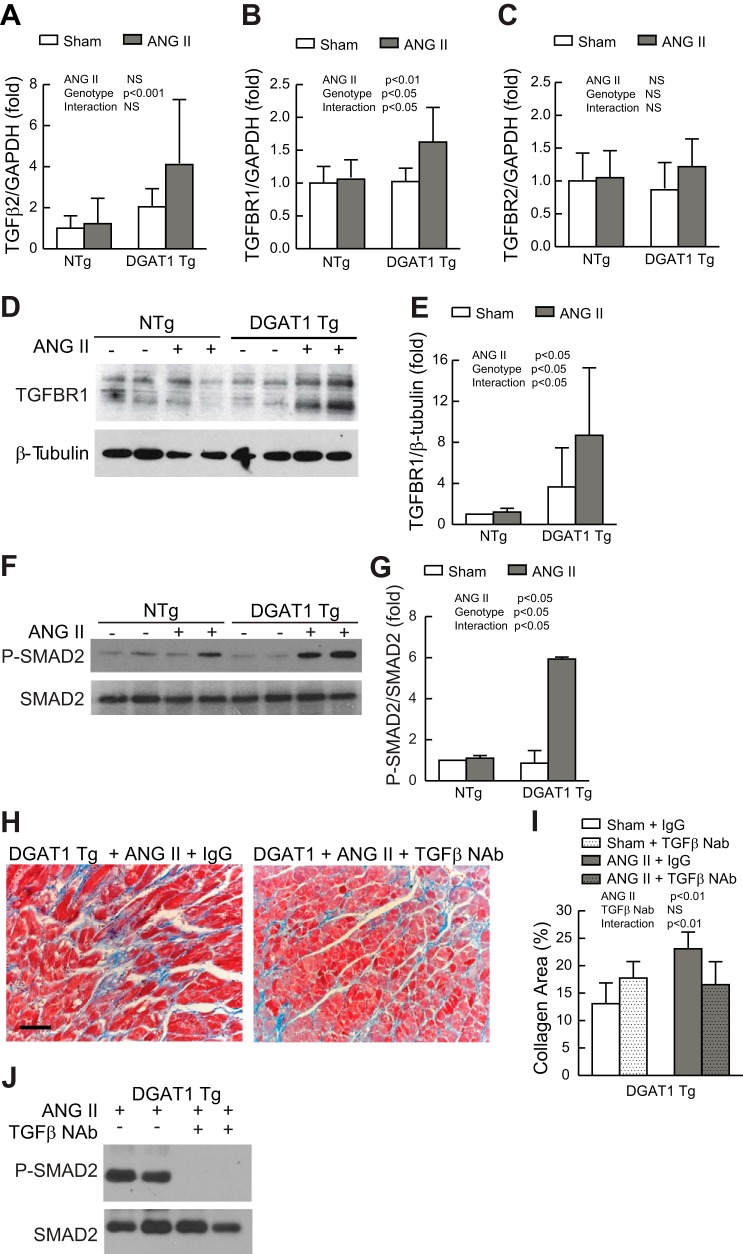
Fig. 5.
Role of transforming growth factor (TGF)-β in MHC-DGAT1 Tg hearts. A–C: gene expression analysis of TGF-β2 (A), TGF-β receptor (TGFBR)1 (B), and TGFBR2 (C). Results were normalized to GADPH expression and compared with the NTg sham group (n = 6 for each group). D: representative Western blot analysis of TGFBR1 expression (top) from membrane preparations of NTg and MHC-DGAT1 Tg hearts. Expression of β-tubulin is shown as a loading control (bottom). E: results were quantified, and TGFBR1 expression was normalized to β-tubulin (n = 4 for each group). F: representative Western blot analysis of phosphorylated (p-)Smad2 (top) and total Smad2 (bottom). G: results were quantified and normalized to total Smad2 (n = 4 for each group). H: representative Masson's trichrome-stained LV micrographs in sham and ANG II-treated NTg and MHC-DGAT1 Tg mice treated with IgG or TGF-β-neutralizing antibody (NAb), where blue-green stain indicates fibrosis. Bar = 50 μm. I: quantification of the fibrotic area, expressed as a percentage of tissue area (n = 4 for each group). J: Western blot analysis of p-Smad2 (top) and total Smad2 (bottom) in MHC-DGAT1 Tg hearts treated with ANG II and either IgG or TGF-β NAb.

