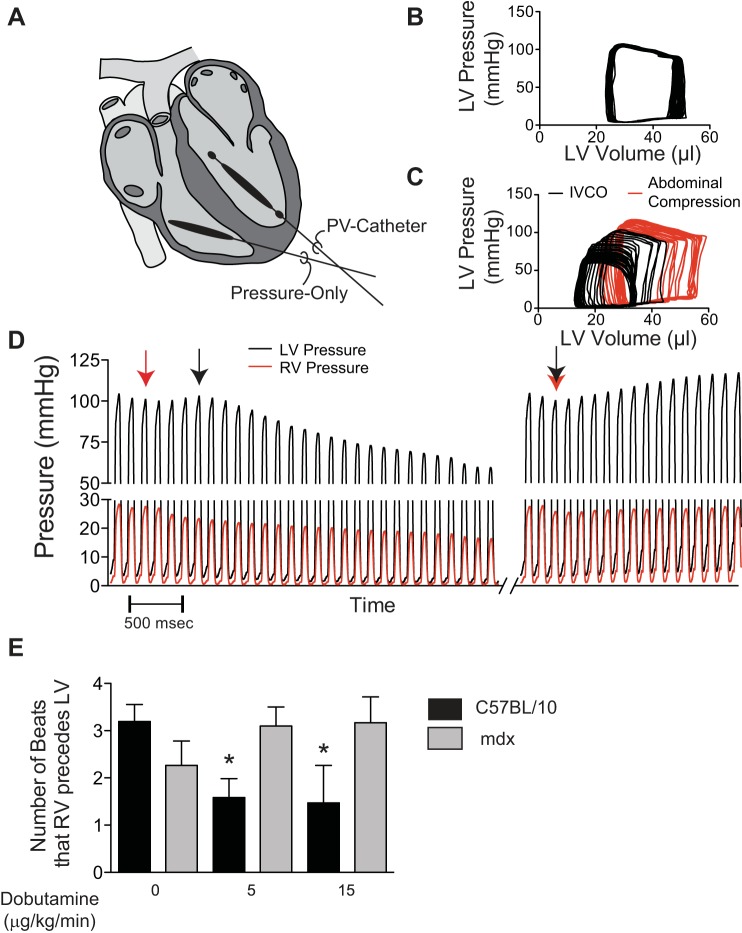
Fig. 3.
Left ventricular pressure-volume loops with simultaneous right ventricular pressure measurements in the mouse. A: a schematic of the approach used to assess right and left ventricular function in aged mdx mice. Representative pressure-volume loops from young wild-type mice under steady-state conditions (B) and with loading conditions altered by occlusion of the inferior vena cava (IVCO; black) or compression of the abdomen (red) (C). D: representative tracings of left and right ventricular pressure during an occlusion of the inferior vena cava. D, left trace: the beginning of the decline in right ventricular pressure is at the left edge of the plot (red arrow) and the black arrow denotes the beginning of pressure decline in the left ventricle. This delay allows for the assessment of coupling between the right and left ventricles (D and E). Changes in ventricular pressures following abdominal compression occur simultaneously in both ventricles (D, right trace: red and black arrows). *P < 0.05 from C57BL/10 baseline data.

