
Fig. 5.
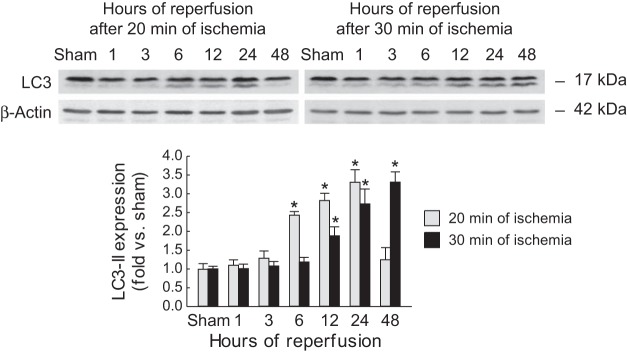
Light chain 3 (LC3) expression in kidneys after mild or severe IRI. Mice were subjected to either 20 or 30 min of bilateral renal ischemia followed by 1, 3, 6, 12, 24, or 48 h of reperfusion. LC3-I (top bands) and LC3-II (bottom bands) expression was assessed in kidneys using Western blot analysis. Values are means ± SD; n = 4. *P < 0.05 vs. sham.