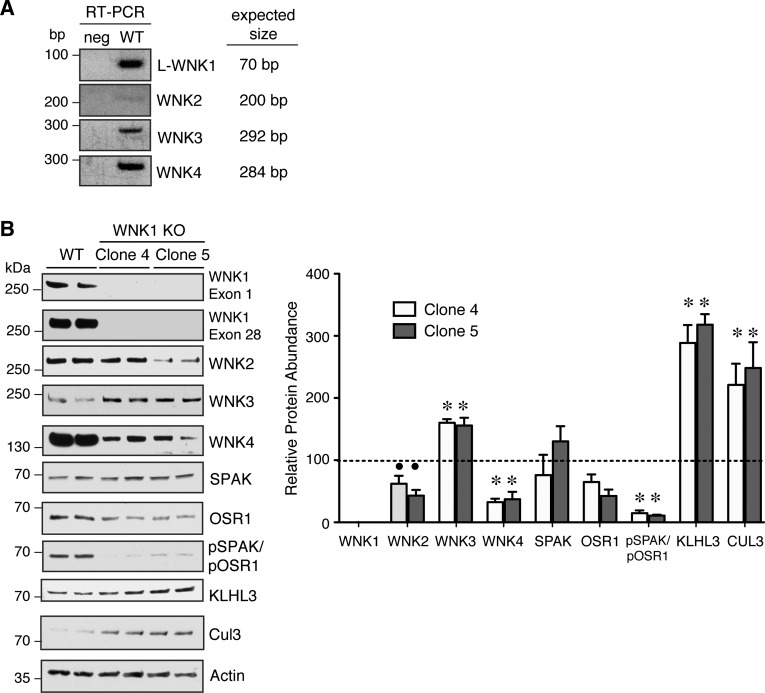
Fig. 3.
Steady-state expression of the endogenous WNK-SPAK/OSR1 pathway in WT and WNK1 KO cells under isotonic conditions. A: agarose gel electrophoresis of RT-PCR products from WT HEK293T cells and template-free negative controls (neg). Predicted PCR amplicon sizes are provided to the right of each image. B: steady-state protein abundance of WNK-SPAK/OSR1 pathway components in WT and WNK1 KO clones 4 and 5. Total protein abundance of WNK2 and WNK4 were decreased in the WNK1 KO cell lines, while WNK3 expression was increased. SPAK/OSR1 activation was decreased in the WNK1 KO cells. The abundance of CUL3 and KLHL3 were similarly increased in WNK1 KOs; n = 4. ∙P < 0.05, *P < 0.001 by 1-way ANOVA, Dunnett's post hoc comparison with WT.

