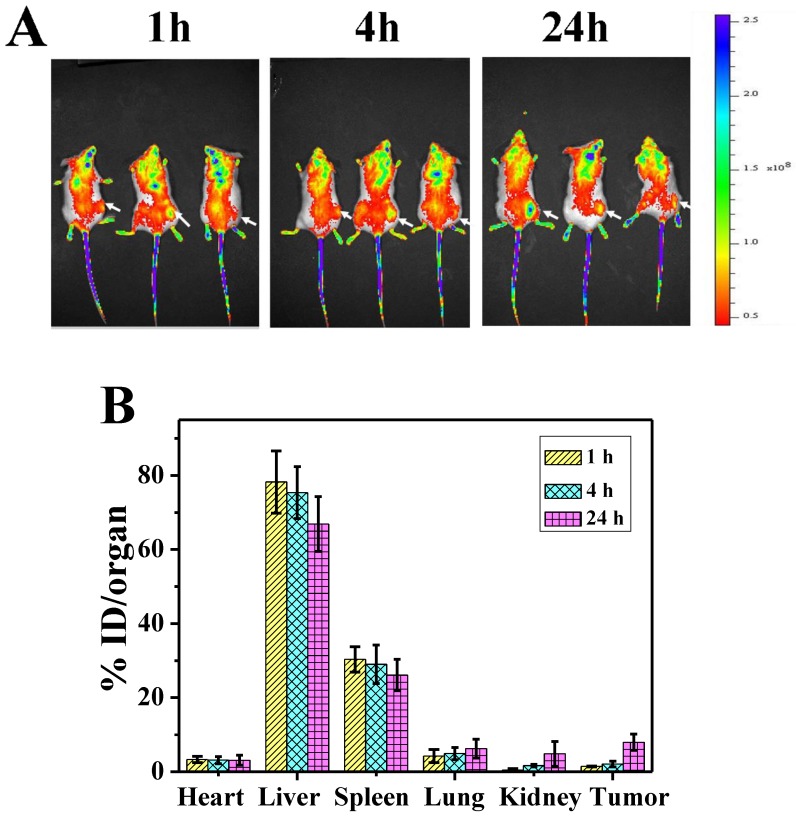
Figure 8.
A) NIR fluorescence images of P-GNRs-820 treated mice were obtained 1 h, 4 h, and 24 h after injection. The arrows indicate tumor sites. B) Biodistribution of P-GNRs in mice at 1 h, 4 h, 24 h after injection determined by ICP-AES measured of Au concentrations. Error bars were based on standard deviations (SD) of three mice per group.

