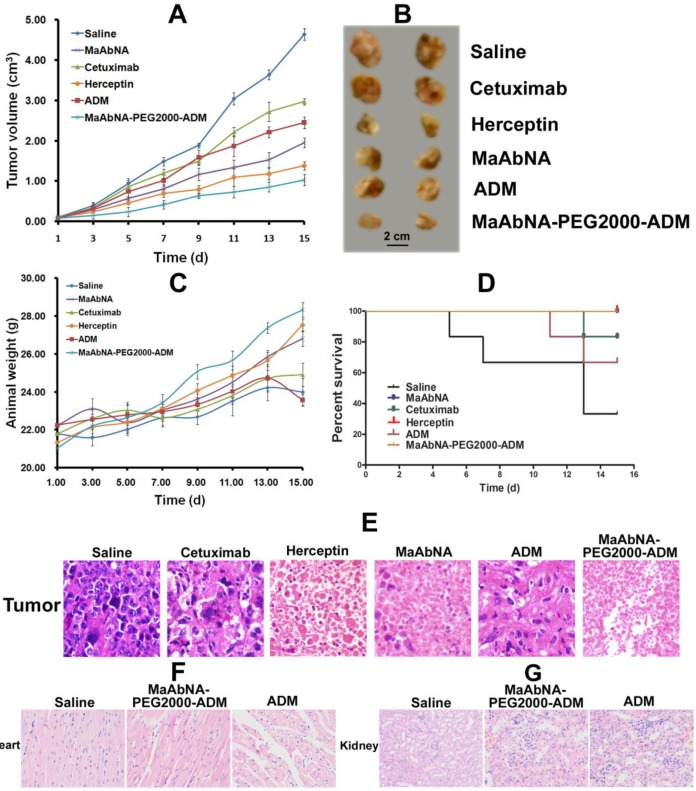
Figure 14.
Therapeutic efficacy of MaAbNA in A549 tumor-bearing nude mice. A, tumor volumes of mice under different treatments (saline, MaAbNA, Cetuximab, Herceptin, ADM and MaAbNA-ADM, n= 6/group). B, tumors separated from mice under different treatments. C, body weights of mice in different groups. D, the 15-day survival rates of mice after administration of different drugs. E, the tissue slices of tumors in different groups. The tissue slices of hearts (F) and kidneys (G) in saline, MaAbNA-PEG2000-ADM and ADM-treated groups. Data are given as mean±SD (n=5). *P <0.05.

