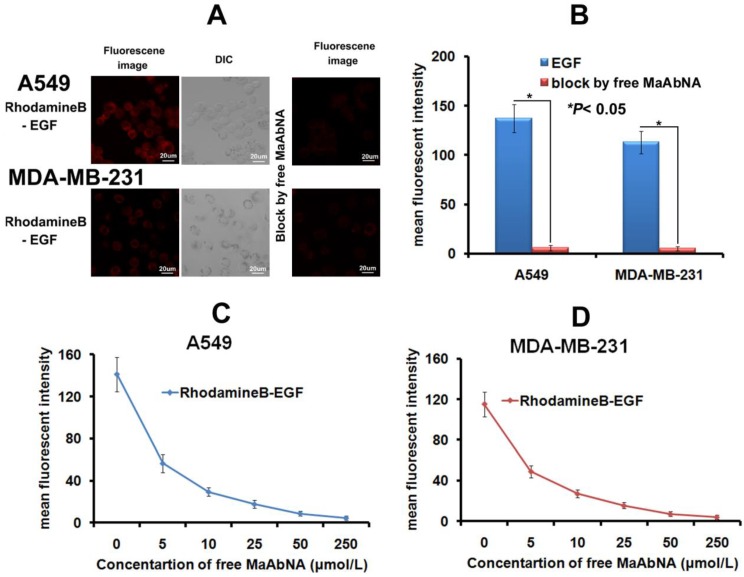
Figure 6.
A, the competitive inhibition of EGF cell-binding conducted by free MaAbNA, which was imaged by a laser confocal microscope. B, mean fluorescence intensity of cells, which was detected by a laser confocal microscope. The competitive inhibition of EGF-binding to A549 (C) and MDA-MB-231 (D) cells by increasing concentrations of free MaAbNA, which was detected by flow cytometer. Data are given as mean±SD (n=5). *P <0.05.

