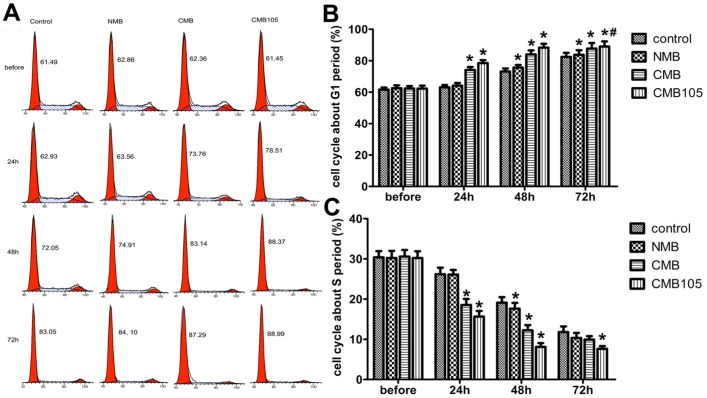
Figure 9.
ES gene transfer induces cell cycle inhibition in the G1 phase. (A) DNA content flow cytometric profiles after transfection with ES gene by ultrasound with NMB, CMB and CMB105. (B) Analysis of the cell cycle in the G1 phase. The cell cycle was clearly inhibited in the G1 phase in the CMB105 and CMB groups transfected for 24 h. Comparisons between groups were performed simultaneously (*P<0.01 relative compared with control, #P>0.05 compared with CMB). n=3 per group. (C) Analysis of the cell cycle in the S phase. The percentage of HUVECs in the S phase was significantly decreased in the CMB and CMB105 groups after transfection for 24 h (*P<0.01 compared with control). n=3 per group.

