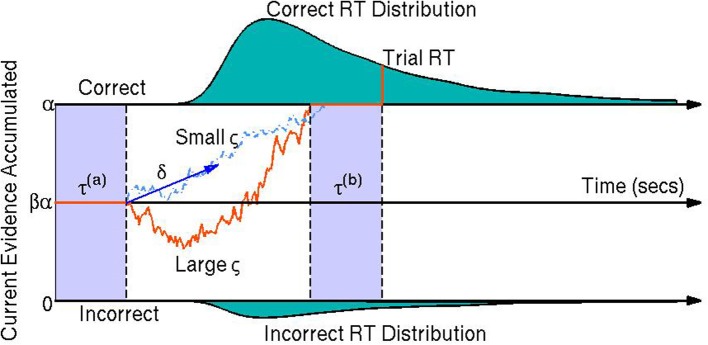
Figure 1.

A visual representation of the diffusion model. The orange line represents the participant's stochastic evidence accumulation process during one trial. When a participant accumulates enough evidence over time for a correct or incorrect response (graphically represented by the top and bottom boundaries at 0 and α, respectively) a decision is made. The drift rate δ is the mean rate of evidence accumulation (evidence units per second) during the participant's decision time on one trial. The bias parameter β represents a bias of the participant toward one choice or the other (set to when the model parameters are expressed in terms of correct over incorrect evidence instead of choice A over choice B evidence). The non-decision time τ is the portion of the participant's reaction time (RT) during the trial not associated with decision making, equal to the sum of encoding/preprocessing time τ(a) and motor response time τ(b) which are not estimable. The boundary separation parameter α represents the amount of relative evidence needed to make a decision. Another parameter is the variability in the evidence accumulation process, the diffusion coefficient ς. In this trial the diffusion coefficient is large in comparison to a smaller diffusion coefficient as shown by the light blue dashed line. The teal shaded areas represent the correct (top) and incorrect (bottom) reaction time distributions. In this example the systematic component of the decision making process is positive δ > 0 indicating a mean trend toward correct responses. However, incorrect responses can still be reached due to the random component of the decision making process (the diffusion coefficient ς). Larger ς indicate that a participant would be increasing likely to make faster decisions, but have closer to chance performance (i.e., an accuracy of β).
