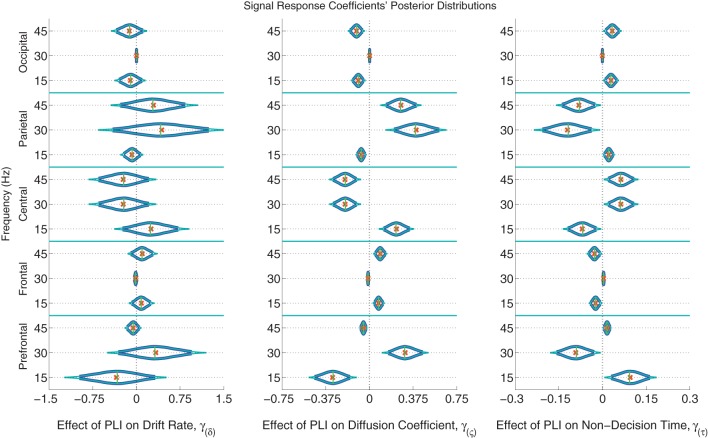
Figure 6.
The marginal posterior distributions of the signal PLI coefficients. I.e., the effects of signal enhancement, as measured by a steady-state phase-locking index (PLI), on the evidence accumulation rate (drift rate; in evidence units per second), variance in the evidence accumulation process (the diffusion coefficient; in evidence units per second), and non-decision time during the response interval (in seconds). Dark blue posterior density lines indicate 95% credible intervals while smaller teal lines indicate 99% credible intervals. Small horizontal green lines embedded in density curves indicate the median of the posterior distributions while the orange crosses indicate posterior means. There is an effect of signal response on the diffusion coefficient and non-decision time that is complex across frequencies and scalp location. A participant whose PLI responses at all locations and frequencies are 0.2 units greater than another participant's responses is expected to have 0.061 evidence units per second larger evidence accumulation variances (where α = 1 evidence unit is required to make a decision) and have 18 ms faster non-decision times, leading to faster but less accurate responses. There was no evidence of an effect of attention to the signal on evidence accumulation rate (the drift rate).

