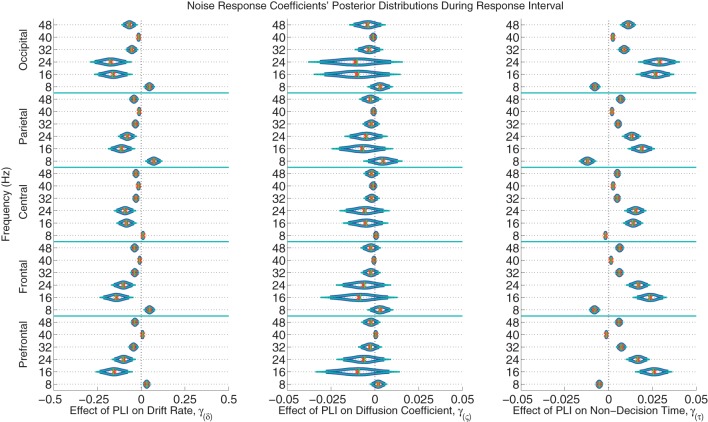
Figure 7.
The marginal posterior distributions of the noise PLI coefficients. I.e., the effects of noise suppression, as measured by a steady-state phase-locking index (PLI), on the evidence accumulation rate (drift rate; in evidence units per second), variance in the evidence accumulation process (the diffusion coefficient; in evidence units per second), and non-decision time (in seconds) during the response interval. Dark blue lines indicate 95% credible intervals, smaller teal lines indicate 99% credible intervals, horizontal green lines indicate posterior medians, and the orange exes indicate posterior means. At noise harmonic frequencies (16, 24, 32, and 48 Hz) during the response interval, those subjects who suppressed noise had faster evidence accumulation rates; this effect was found at all electrode groups. However, noise enhancement at 8 Hz was associated with slower evidence accumulation. Furthermore, those subjects who better suppressed noise at the same harmonic frequencies had faster non-decision times. For example, a participant whose PLI responses were suppressed 0.2 units more than another participant's responses at all locations and frequencies during the response interval is expected to accumulate 0.288 evidence units per second faster (where α = 1 evidence unit is required to make a decision) and have 48 ms faster non-decision times, leading to faster and more correct responses. There was no evidence of an effect of attention to the visual noise on variance in evidence accumulation (the diffusion coefficient).

