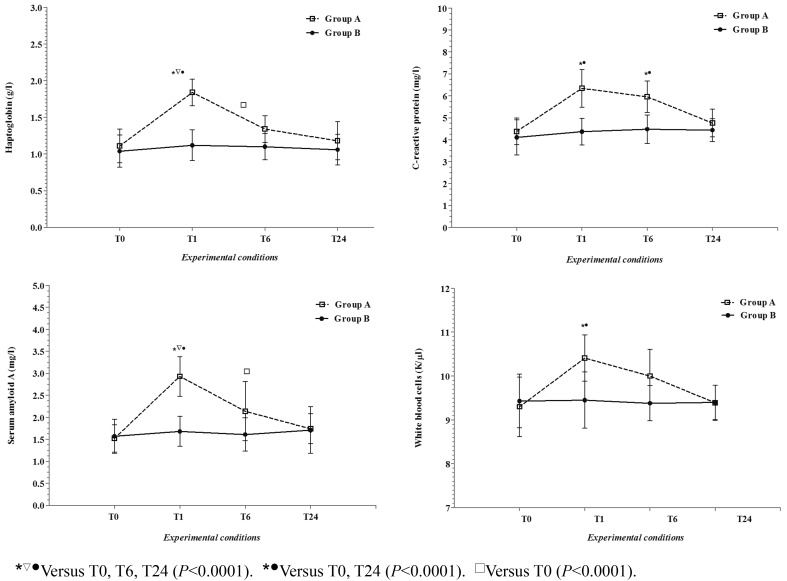
Fig. 1.
The patterns of the mean values (±SD) of haptoglobin (Hp), serum amyloid A (SAA), C-reactive protein (CRP), and white blood cells (WBC) together with the statistical significances obtained in Group A (dogs subjected to transportation) and in Group B (dogs not subjected to transportation) during the experimental period (T0, before the transportation; T1, immediately after 3 hours of transportation; T6, more than 6 hours after the end of transportation; T24, more than 24 hours after the end of transportation).

