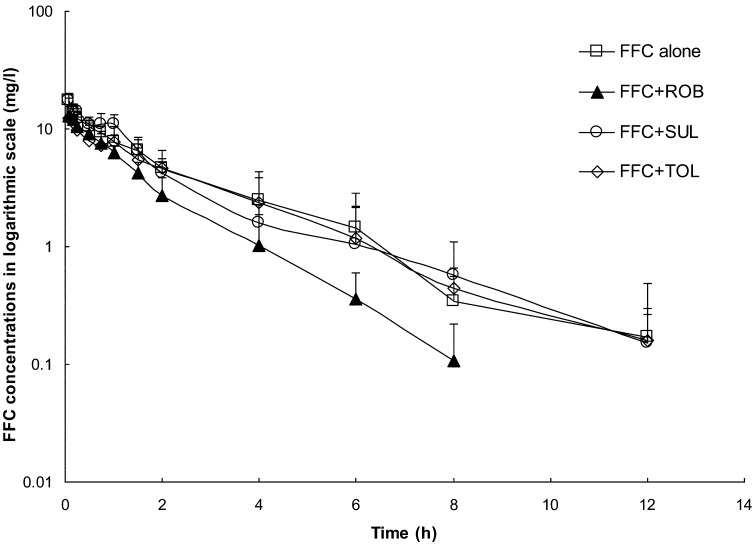
Fig. 1.
The semilogarithmic plot of the mean plasma concentration-time curves of florfenicol (FFC) following a single intravenous injection (25 mg/kg) into rabbits after anticoccidial-free (FFC alone group), SUL (FFC+SUL group), ROB (FFC+ROB group), and TOL (FFC+TOL group) feeding for 20 days. Results are presented as the mean ± SD (n=8).

