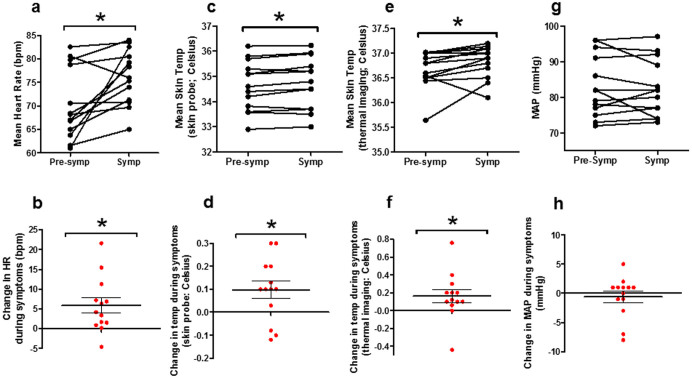
Figure 3. Physiological changes associated with hot flush episodes in healthy women.
Mean heart rate (a), skin temperature by skin probe (c), skin temperature by thermal imaging (e) and mean arterial pressure (MAP) (g), during 5 minute period pre-symptom onset (Pre-symp) and during symptom period (Symp) using the minutely recordings. Parts b, d, f and h represent change in respective physiological parameter when compared with pre-symptom level. As MAP was recorded every 5 minutes (rather than minutely so as to avoid discomfort), the MAP measurement immediately prior to symptoms was compared to that at symptom onset or closest after symptom onset. Data presented as mean ± SEM. *P < 0.05.

