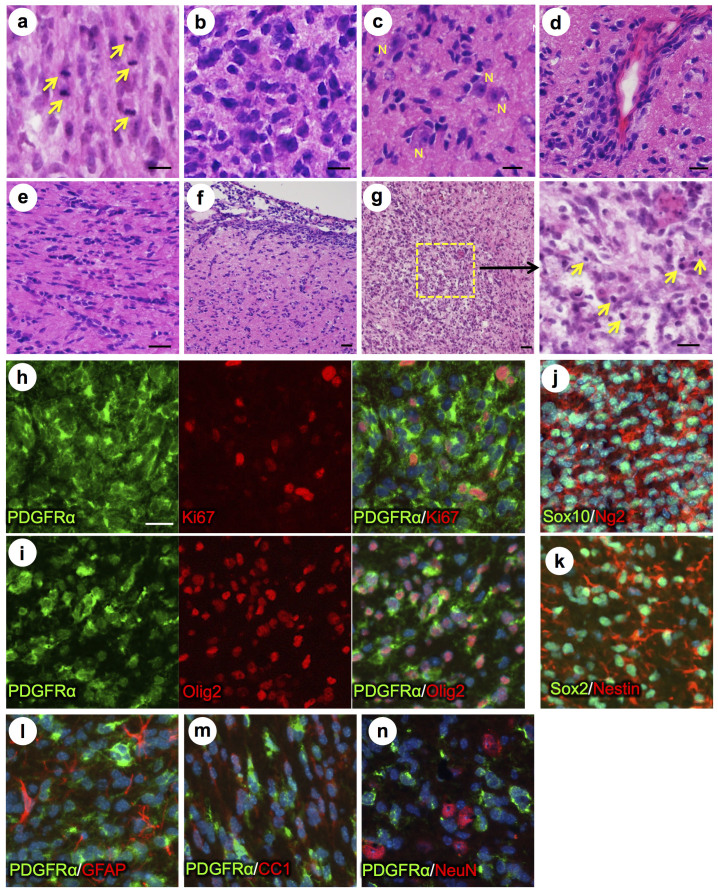
Figure 2. PDGFRα driven brain tumors display features of high grade glioma.
(a–g) Histopathological analysis of tumor areas by H&E staining shows a high concentration of mitotic figures (a, arrows), high cellularity and nuclear atypia (b), perineuronal satellitosis (c; N, neuronal nuclei), perivascular growth (d), intrafascicular growth (e), subarachnoid spreading (f), and areas of incipient necrosis (g; arrows point to pyknotic nuclei). (h–k) IF labeling of brain tumor sections for cell type specific markers. Nuclei labeled with DAPI are shown in blue. Tumor cells with high PDGFRα expression were highly proliferative, as seen by proliferation marker Ki67 (h), and express the OPC cell lineage markers Olig2, Sox2, Sox10, and Ng2, as well as the neural stem cell marker Nestin (i–k). Tumor cells were negative for immunosignal of astroglial marker GFAP, mature oligodendrocyte marker APC-CC1, and neuronal marker NeuN (l–n). Scale bars: 10 μm (a–g), 20 μm (h–n).

