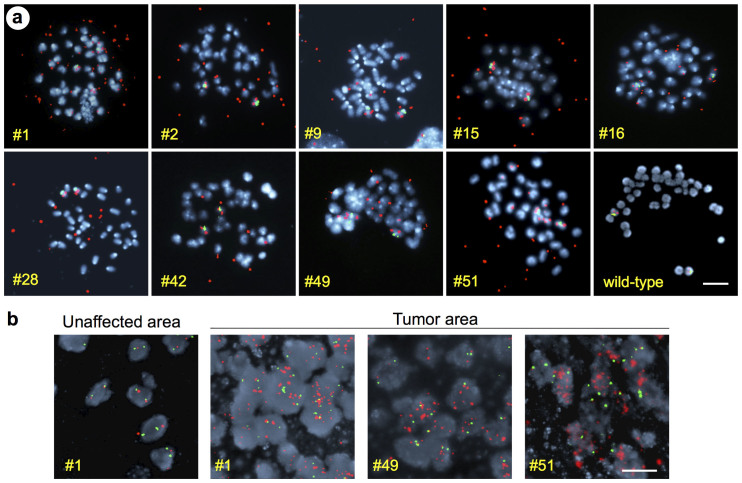
Figure 4. Double minute amplification of PDGFRα.
(a) Metaphase spreads of 9 Pdgfra amplified cell lines and one wild-type control line, hybridized with FISH probe for PDGFRα locus (red) and chromosome 5 centromere region (green), revealing amplification of PDGFRα locus as extrachromosomal DM. The cell line number is indicated in each image. (b) FISH hybridization on brain tumor sections confirms amplification of PDGFRα locus in situ. Examples of three brain tumors and one unaffected adjacent area are shown. The number of the corresponding cell line is indicated in each image. Chromosomes and nuclei labeled with DAPI are shown in blue. Scale bars: 5 μm (a), 20 μm (b).

