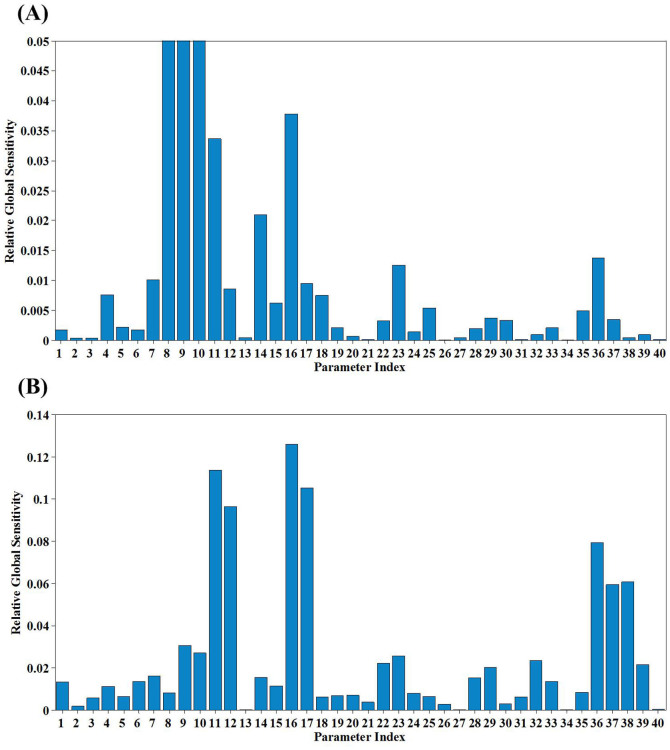
Figure 4. Global parameter sensitivity analysis results.
(A, Parameter sensitivity analysis for the SBR system (parameter 8, 9 and 10 reached 0.20, 0.13 and 0.46, respectively; B, Parameter sensitivity analysis results for the CSTR system; The indexes and their corresponding parameters are listed as the follows: 1- iN,SS, 2- iN,XI, 3- iN,BM, 4- fXI,  ,
,  ,
,  ,
,  ,
,  ,
,  , 11-YAOB, 12-YNOB, 13- kH, 14- kSTO, 15-μH, 16-μAOB, 17-μNOB,
  ,
,  , 20-bAOB, 21-bNOB,
  ,
,  ,
,  ,
,  , 26-ηN,end, 27- KX,
  ,
,  , 30-KH,SS,
  ,
,  ,
,  , 34-KH,ALK, 35-KH,STO,
  ,
,  ,
,  ,
,  , 40-KN,ALK. The meanings of each parameter can be found in Table S4, SI).

