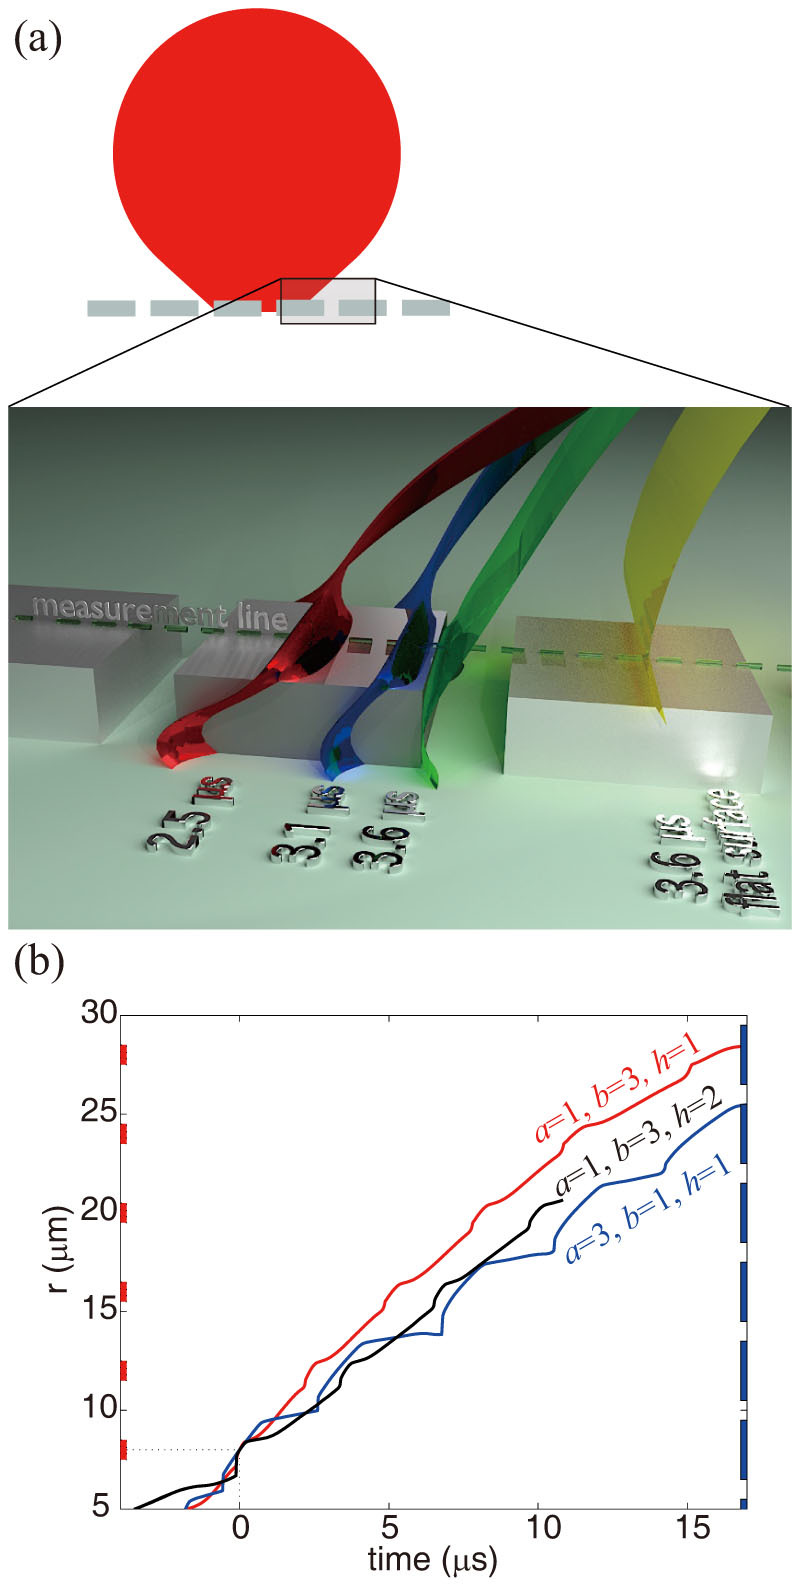
Figure 4.

(a) Snapshot of the CHNS simulation for spreading on 3-D microstructures. The red, blue, and green surfaces show the liquid-gas interface, moving from left to right, at times 2.5, 3.1, and 3.6 μs respectively. For comparison, the droplet interface is also shown for the case of a perfectly flat surface (yellow). (b) Simulated contact line position as a function of time, highlighting the oscillation in velocity corresponding to the positions of the pillars, shown on the left side of the graph for (a, b, h) = (1, 3, 1) and on the right side for (a, b, h) = (3, 1, 1).
