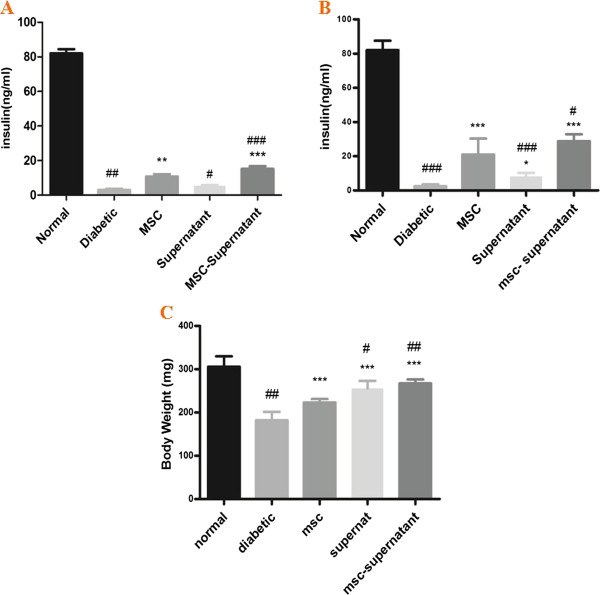
Figure 4.

Effect of MSCs transplantation, supernatant administration and co-administration of MSCs with supernatant on serum insulin levels and body weights in different animals. Values are mean ± SEM. A, serum insulin levels at week 4. B, serum insulin levels at the end of study at week 6. C, body weight of animals at the end of study. *; MSC, supernatant, MSC-supernatant groups vs. diabetic control group. #; Diabetic, supernatant, MSC-supernatant groups vs. MSC group.*, P < 0.05; **, P < 0.01; ***,P < 0.001. #, P < 0.05; ##,P < 0.01; ###, P < 0.001.
