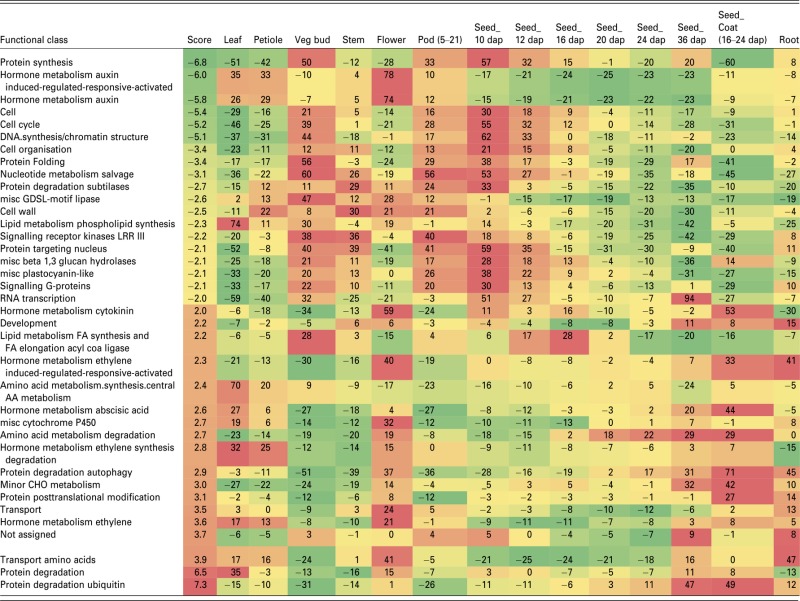
Table 2.
pageman display of over-represented categories deregulated in 8 DAP dash pods compared with WT. Log2 ratio of mutant data versus WT data from three replicates. Only classes with significant changes according to the normalized Wilcoxon test (= score) are represented. Data from the Medicago Gene Expression Atlas (Benedito et al., 2008) were normalized and added
 |
