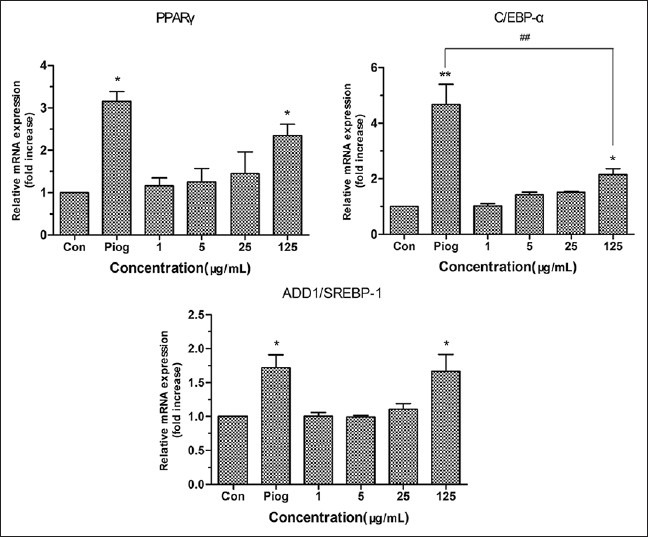
Figure 4.

Effects of TC on the expression of main genes related to differentiation in 3T3-L1 adipocytes. The values are expressed as means ± SD of three independent tests. *P<0.05 and **P<0.01 as compared with 1% DMSO-treated control group; ##P <0.01 TC vs Piog
