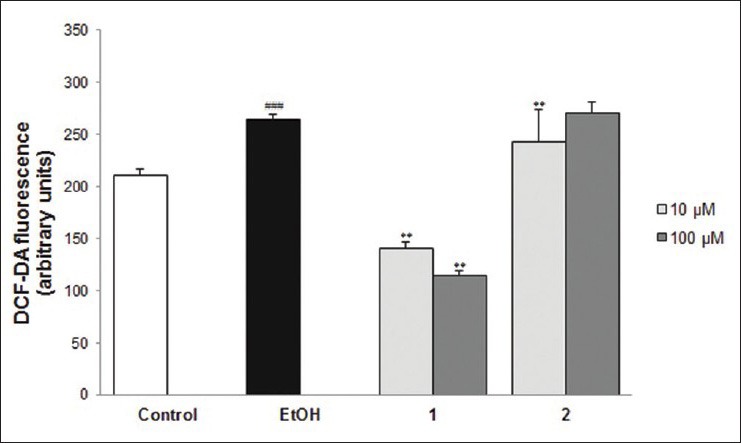
Figure 2.

The effects of compounds 1 and 2 on intracellular reactive oxygen species formation in ethanol-treated primary rat hepatocytes. Values represent the mean ± standard deviation from three independent experiments. #P < 0.05, ##P < 0.01, ###P < 0.001 compared with control. *P < 0.05, **P < 0.01, ***P < 0.001 compared with ethanol group
