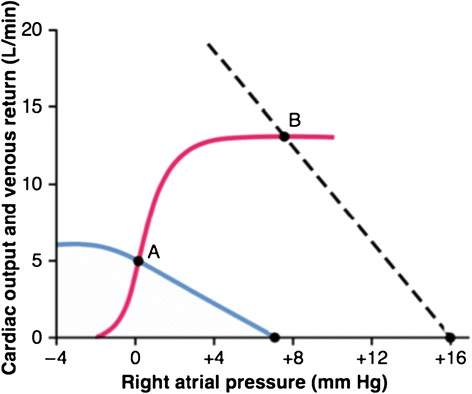
Figure 6.

Guyton’s combination of two curves to model the circulation. The intersection of the red cardiac performance and blue venous return curves determines cardiac output. Point A is the normal rest situation. Cardiac output is higher when the dashed line is the venous return curve and intercepts the same cardiac performance curve at point B. Image reproduced with permission from [30].
