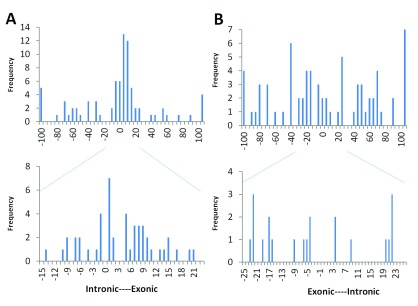
Figure 5. Distribution of activated cryptic sites.

The frequency of validated cryptic splice acceptors ( A) and donors ( B) occurring at positions relative to the natural splice site. Positions are given using ASSEDA coordinates. Lower panel expands the cryptic site distribution of the region circumscribing the natural splice site.
