Graph 1.

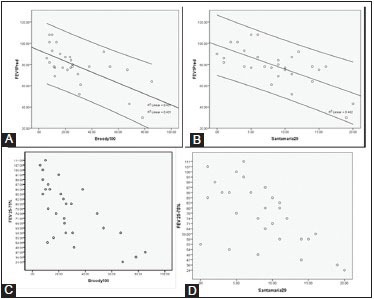
Scattergraph showing linear relation of diminishing FEV1 with increasing CT score [Broody (A) and Santamaria (B)]. Similar relation is also noted with FEV25-75% (C and D)

Scattergraph showing linear relation of diminishing FEV1 with increasing CT score [Broody (A) and Santamaria (B)]. Similar relation is also noted with FEV25-75% (C and D)