
Figure 1.
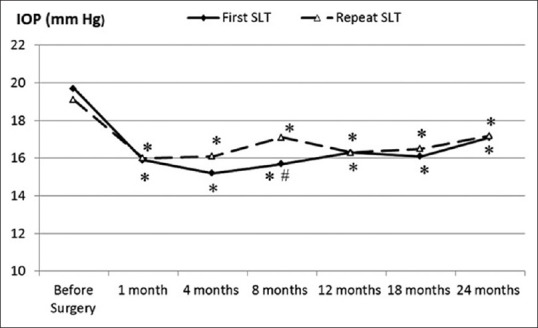
Mean intraocular pressure (IOP) at all time points following first and repeat SLT. *Mean IOP was statistically lower than baseline (P< 0.05), #mean IOP statistically different between first and repeat SLT.
Official websites use .gov
A
.gov website belongs to an official
government organization in the United States.
Secure .gov websites use HTTPS
A lock (
) or https:// means you've safely
connected to the .gov website. Share sensitive
information only on official, secure websites.
Mean intraocular pressure (IOP) at all time points following first and repeat SLT. *Mean IOP was statistically lower than baseline (P< 0.05), #mean IOP statistically different between first and repeat SLT.